The Isolation Forest is a unsupervised anomaly detection technique based on the decision tree algorithm. The main idea is that a sample that travels deeper into the tree is less likely to be an outlier because samples that are near to each other need many splits to separate them. On the other hand are samples in shorter branches easier to separate from the rest of the samples and therefore potential outliers.

Program code in GitHub repository
As always you find the whole Jupyter notebook that is used to create this article in my GitHub repository.
How the Isolation Forest is Build
The method how the Isolation Forest is build, describes the following section.
- Pick a random sub-sample of the data and assign this sample to a binary decision tree
- Start branching: Pick a random feature and branch based on a random threshold based on the minimum and maximum of that feature.
- If the sample has a value for that feature less than the threshold, the sample moves to the left branch and if the value is higher or equal the threshold, move o the right branch.
- The branching is done until each sample is completely isolated in a branch or the max depth is reached.
- Now repeat the steps with all features.
Deeper Information of the Isolation Forest technique can be found in the paper: Extended Isolation Forest
Implementation of the Isolation Forest Algorithm
The following section shows how to build an Isolation Forest Algorithm in Python based on the Boston House Prices Kaggle dataset. First we must get rid of all missing values in the dataset and save all numeric features to a new list. Only the numeric features are selected to fit to the algorithm. With the predict function of the Isolation Forest we get the anomaly scores of each sample. Outliers have an anomaly score of -1.
import pandas as pd
import numpy as np
from sklearn.ensemble import IsolationForest
df = pd.read_csv(
filepath_or_buffer = '../train_bostonhouseprices.csv',
index_col = "Id"
)
# drop all columns with a lot of missing values
df = df.drop(["Alley", "PoolQC", "Fence", "MiscFeature", "FireplaceQu"], axis='columns')
# drop all rows with missing values
df = df.dropna(axis='index')
col_numeric = list(df.drop("SalePrice", axis='columns').describe())
model=IsolationForest(n_estimators=100,max_samples='auto')
model.fit(df[col_numeric])
df['scores'] = model.decision_function(df[col_numeric])
df['anomaly_score'] = model.predict(df[col_numeric])
# all outliers have an anomaly score of -1
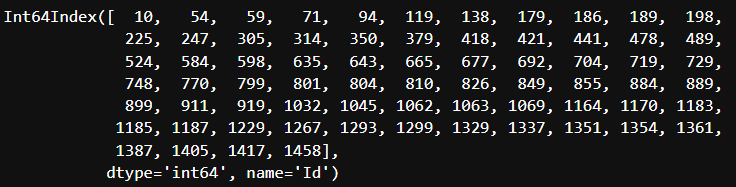
df[df['anomaly_score']==-1][col_numeric].indexThe output of this script are the indexes that are labeled as outliers and should be further analyzed to maybe drop the samples from the dataset.